You have a feature update policy aimed at 1,200 Windows 11 devices. A few weeks in, 300 of them have not moved. Intune shows some as Error, some as Pending, a few as Needs attention. Every one of those is a separate little investigation, and each investigation starts in a different place.
This post builds a small, read-only PowerShell tool that does the first pass for you. It reads the feature update report you already have, sorts every device into a likely blocker, and puts a confidence level on each call: Confirmed, Suspected or Unknown. The point is not to be clever. The point is to never claim a cause the data does not show.
Intune's feature update report is produced per policy, mixes data that arrives on different clocks, and names an alert but not always a cause. The Windows Upgrade Blocker Analyzer takes those exports (plus an optional device inventory), maps all 46 alert messages Microsoft documents to a cause and a next step, and writes a standalone HTML dashboard, CSV and JSON. It never changes a device, never touches a safeguard hold, and says Unknown when the evidence is missing. Version 1 works from CSV files, not Graph, because Microsoft's documented export-creation call needs write permissions.

The problem: Intune says "Error", and then you are on your own
Microsoft gives you two views of a feature update rollout. The Windows Feature Update Report lists every targeted device with an update state. The Feature update failures report lists devices that hit an alert, with a named alert message such as DiskFull or SafeguardHold. Both are useful. Neither answers the question you actually have, which is: for each of these 300 devices, what should I look at first?
In practice you want five answers:
- Which devices are behind the version I am targeting?
- Which of those have a confirmed error, or a hold?
- Which have a policy problem, such as a conflict, a pause or a deferral?
- Which need someone to look at the device itself?
- What is the next step for each group?
Getting those answers by hand means opening the feature update report, the failures report, the devices list and the policy, and keeping the results straight in a spreadsheet. It is slow, and it is easy to quietly treat "no data" as "no problem".
Why it happens: three data sources, two clocks, one report per policy
The reports are accurate. The trouble is how they fit together. Four facts, all from Microsoft's own documentation, explain most of the confusion.
The report is per policy
Microsoft's Graph reference for the feature update device report (FeatureUpdateDeviceState) lists PolicyId as a required filter. In the portal you also pick one feature update profile before you can generate the report. So a tenant with three feature update policies has three exports.
The consequence is easy to miss: a device that is missing from one export is not necessarily untargeted. It may simply belong to a policy you did not export. A tool that reports "no targeting" from a single file is guessing.
The data arrives on two clocks
Microsoft describes two kinds of data in these reports:
- Service-side data from Windows Update typically arrives in less than an hour. It tells you what the update service knows, for example that a device cannot register with Windows Update.
- Client-side data from Intune devices is processed in batches that refresh every eight hours, and it only exists after you configure data collection. It carries things like a device not having enough disk space.
So two exports taken minutes apart can legitimately disagree, and an inventory taken last week disagrees with both. The tool therefore prints the time the evidence is judged against, shows the observation time on every finding, and raises a specific mismatch finding instead of choosing a winner.
An alert is a clue, not always a cause
Microsoft documents 46 alert messages for the failures report. Some name a real cause (DiskFull). Some name a symptom (InstallSetupError). One is described by Microsoft itself as usually false: for PostRestartIssue the documentation says the error is usually false and the update probably succeeded. A tool that treats every alert as a confirmed blocker would send you chasing devices that are fine.
This is how the analyzer groups them. The full mapping is in the repository README.
| Group | Example alert messages | Microsoft's guidance, paraphrased |
|---|---|---|
| Safeguard hold | SafeguardHold | Read the hold ID in the report's Deployment Error Code column, then check the Windows release health dashboard. |
| Compatibility | Incompatible, IncompatibleArchitecture | Review ScanResult.xml on the device for Block Type=Hard. |
| Disk space | DiskFull | Free up space on the Windows partition and retry. |
| Policy conflict | PolicyConflict, PolicyConflictDeferral, DeploymentConflict | Check MDM and Group Policy settings against the deployment, or remove the device from the extra deployment. |
| Device registration | DeviceRegistrationIssue and three variants | Check Microsoft Entra join state, and that the Microsoft Account Sign-in Assistant service is not disabled. |
| Download | DownloadTimeout, DownloadConnectionIssue | Check network, proxy or firewall, WSUS if used, and the BITS service. |
| Installation | InstallSetupError, InstallFileLocked | Check that the BIOS and drivers are up to date, then retry. |
| Rollback | RollbackInitiated | Run SetupDiag and do not retry until the cause is understood. |
| Probably a false alarm | PostRestartIssue | Check the update actually installed before doing anything. |
What the export does not contain
The documented columns include the policy, the target version, the update state and substate, the last scan time and the latest alert message with its recommended action. They do not include the setup logs, a hardware inventory, or the result of Intune's assignment evaluation for your groups. That is why some of the tool's findings stop at Unknown. When the cause lives on the device, a report cannot name it, and the honest output is a pointer to the device-level evidence.
POST /deviceManagement/reports/exportJobs) lists only ReadWrite permissions: DeviceManagementConfiguration.ReadWrite.All, DeviceManagementApps.ReadWrite.All or DeviceManagementManagedDevices.ReadWrite.All, for delegated and application access alike. A script that creates its own exports cannot honestly be called read-only on that basis. This is the reason version 1 works from files you export yourself.How to verify: get the right exports before you analyse anything
Nothing downstream is better than its input. Spend five minutes here and the rest is quick.
Step 1: list your feature update policies
Open Devices › Manage updates › Windows updates › Feature updates. Every policy shown here needs its own export. Write the names down.
Step 2: generate the report for each policy
- Sign in to the Microsoft Intune admin center.
- Go to Reports › Windows Updates. The default view is the Summary tab.
- Select Windows Feature Update Report.
- Select Select a feature update profile, choose the first policy, then select Generate report.
- Export the result as CSV, if your report offers an export option, and name the file after the policy.
- Repeat for every other policy.
Step 3 (recommended): export the device inventory
Export the Intune Devices report with at least the device ID, device name, OS version and last check-in time. It lets the tool catch things the feature update report cannot show: devices that stopped checking in, devices still on Windows 10, and devices that are behind but in none of your exports.
Step 4: check the columns
The tool accepts both the Graph property names and the portal's column labels, compared without regard to case or spaces, so DeviceId and Intune Device ID are the same column. Confirm your file has a device ID column. This one-liner prints the column names of the first row:
If the state columns hold numbers instead of words, Intune has given you the raw enum values. Microsoft's export API documentation explains that each localisable column can have a second column ending in _loc with the readable text, and the tool prefers that column when it exists. If neither is readable the tool reports the state as unrecognised and does not guess.
The fix: classify the evidence, with a confidence level on every finding
"Fix" is a strong word for a reporting tool. What it fixes is the triage: instead of 300 equal-looking devices you get a ranked list, grouped by cause, where every call says how sure it is.
How it works
Two design choices matter more than the rest.
Match on IDs, not names. Two different laptops can carry the same name, for instance after a re-image. The tool keys every record on the Intune device ID, keeps the two records apart, and flags both as having a duplicate name.
Keep every finding. A device can be stale and have an older install error. Forcing one diagnosis would hide one of them, so the tool keeps both, each with the time it was observed.
The confidence model
| Level | It means | Example |
|---|---|---|
| Confirmed | An explicit status or alert from the report or inventory names the cause. | Alert DiskFull on a device that is behind target. |
| Suspected | Several signals point at a likely cause, but none proves it. | An install has shown no new event for 12 days. |
| Unknown | The evidence is missing, stale or contradictory. | A device behind target that appears in none of the exports you supplied. |
Run it
The tool needs PowerShell 7 or Windows PowerShell 5.1 and no extra modules. The repository ships synthetic sample data, so you can try it before touching real exports. -AsOf pins the clock so the output is repeatable.
For your own data, pass one report file per policy and the inventory:
It writes four files to .\wuba-output: the dashboard, a findings CSV, a devices CSV and an evidence JSON. The three thresholds (-StaleCheckinDays 30, -StaleScanDays 14, -StalledDays 7) are this tool's defaults, not Microsoft values. Change them to suit your estate.
The findings it produces
| Finding | Based on | Confidence |
|---|---|---|
SafeguardHold | Alert SafeguardHold | Confirmed |
CompatibilityBlock | Alerts Incompatible* | Confirmed |
InsufficientDiskSpace | Alert DiskFull | Confirmed |
PolicyConflict | Alerts PolicyConflict*, DeploymentConflict | Confirmed |
InstallationFailure, RollbackInitiated | Install and rollback alerts or states | Confirmed |
UpdateOnHold | On hold state: admin paused, service paused, deferred | Confirmed |
StaleDevice | Inventory check-in older than threshold | Confirmed |
Windows10Device | Inventory build below 22000 | Confirmed |
PostRestartResultUnknown | Alert PostRestartIssue | Suspected |
StalledInstall, StaleWindowsUpdateScan | No recent event, or an old scan | Suspected |
ReportInventoryMismatch | Report says installed, inventory build is lower | Suspected |
NotInFeatureUpdateReport | Behind target and in none of your exports | Unknown |
NeedsAttentionNoDetail, UnmappedAlert, InsufficientEvidence | A problem state with no usable detail | Unknown |
Reading the dashboard
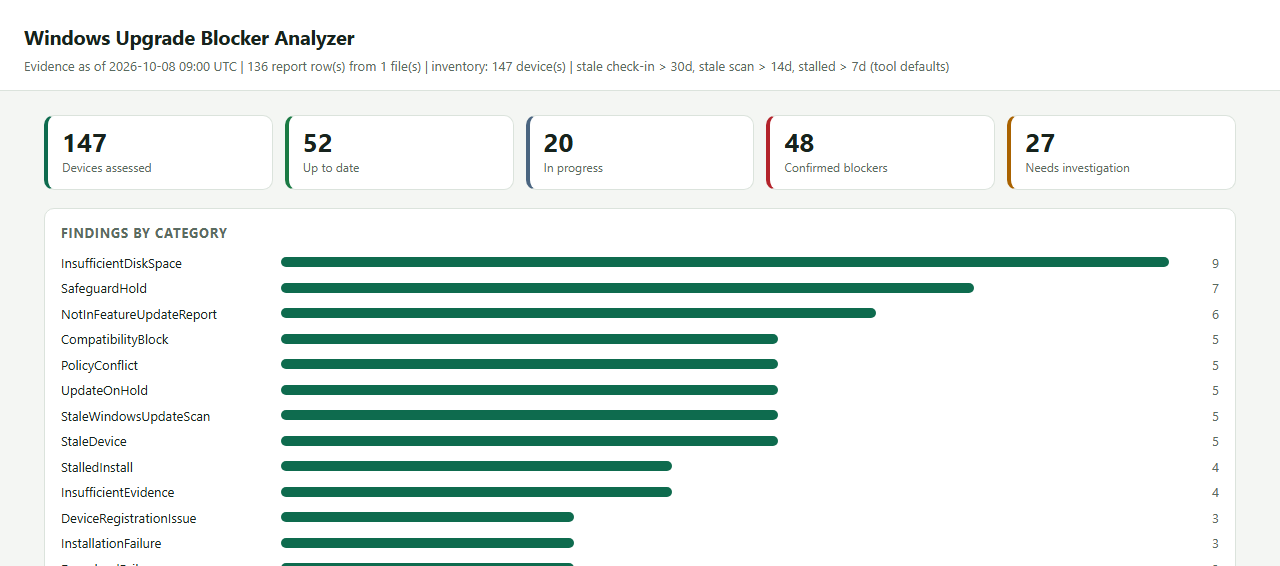
The report is one standalone HTML file. It needs no web server, loads nothing from the internet and works offline. The top shows how many devices are up to date, in progress, confirmed blockers, and needing investigation, then a chart of findings by category.
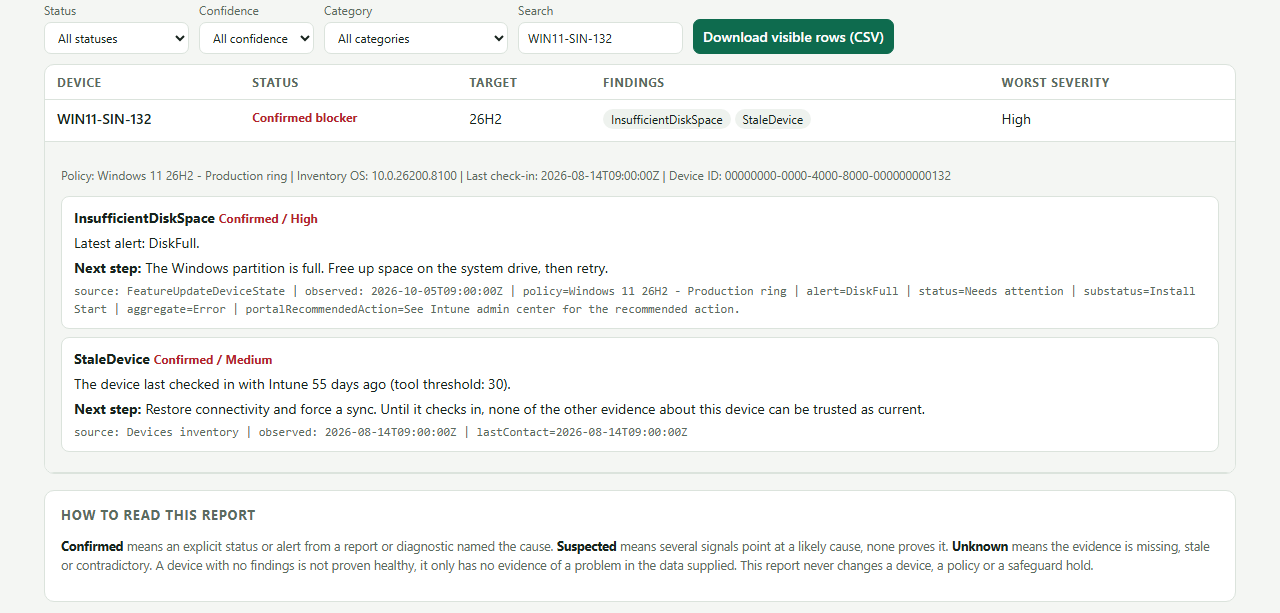
Below the chart is a filterable, sortable device table. Select a device and its evidence opens: every finding, its confidence and severity, the source it came from, when it was observed, and the next step.
DiskFull alert from the feature update report, and a 55-day-old check-in from the inventory. Synthetic data.wuba-report.html#category=SafeguardHold, and it opens with that filter applied. Supported keys are status, confidence, category, q and device.What to do with each group
- Safeguard hold. Microsoft's guidance is to read the hold ID and check release health. Do not try to work around it. The tool deliberately offers no bypass. The site has a full walkthrough in A Safeguard Hold Is Blocking Your Feature Update.
- Compatibility block. Check
ScanResult.xmlforBlock Type=Hard. If the device is Windows 10, start with the Windows 11 hardware requirements check. - Installation failure or rollback. This is where the device-level logs matter. Run SetupDiag, then read the results with SetupDiag: automatic upgrade failure analysis or work through a rollback code with decoding 0xC1900101.
- Disk space, policy conflict, download. These are usually fixable at fleet level: free space, review deferral, pause and update-source policy, check proxy and BITS.
- Stale device. Fix connectivity first. Until the device checks in, nothing else you know about it is current.
- Unknown. Treat as a to-do, not a verdict. Collect local diagnostics, or re-export the policy the device actually belongs to.
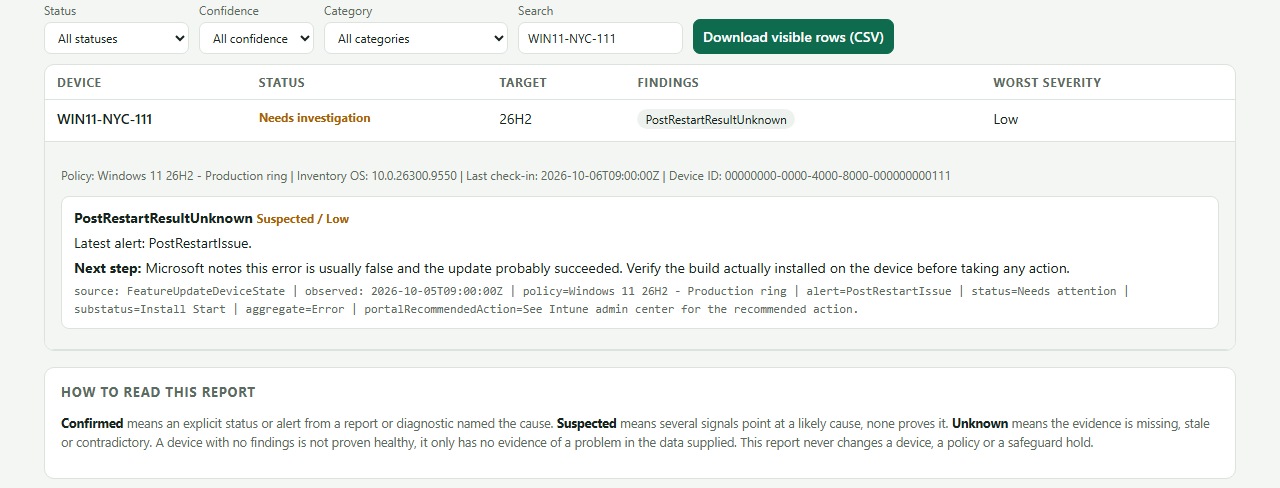
PostRestartIssue looks alarming in the failures report, but Microsoft says the error is usually false. The tool marks it Suspected at low severity. Confirm the build on the device before you open a ticket.Privacy and safe sharing
A device name is not trusted data. It is a string set by whoever imaged the machine, and it ends up in a CSV and a web page. The tool treats every name that way:
- HTML. Data is embedded as JSON with
<,>and&escaped, the page is built withtextContentonly, and a Content-Security-Policy blocks all network access. A device named like a script tag shows up as plain text. - CSV. Cells starting with
=,+,-or@get a leading apostrophe so a spreadsheet will not run them as formulas. - People. UPNs are left out unless you pass
-IncludeUpn, and-RedactDeviceNamesswaps names for a stable pseudonym built from the device ID.
Treat the output files as sensitive regardless. They still contain device IDs and, unless redacted, device names.
Proof it worked: 147 sample devices, from export to answer
The sample set has 136 report rows and 147 devices in the inventory, so 11 devices appear only in the inventory. All of it is synthetic. Here is the real console output of the command above:
Read it from the top. Of 147 devices, 52 are up to date (50 report an installed update, 2 are inventory-only devices already on the target build). 48 have at least one Confirmed blocker of medium or high severity. 27 need a human to look because the evidence is only Suspected or Unknown. 20 are simply in progress, with nothing wrong in the data.
Three devices worth opening
A device with two findings. WIN11-SIN-132 has a DiskFull alert and has not checked in for 55 days. The tool keeps both: the alert says what stopped the install, the stale check-in says its other evidence may be out of date. See the evidence screenshot above.
A device that is probably fine. WIN11-NYC-111 shows PostRestartIssue. The tool reports it as Suspected, low severity, with Microsoft's own caveat as the next step.
Two devices with the same name. WIN11-LON-010 exists twice with different device IDs. One installed the update. The other is in the inventory, behind target, and in no report, so it is flagged NotInFeatureUpdateReport with Unknown confidence rather than "not targeted". Matching on names would have merged them and hidden the second.
The tests, and proof they can fail
The repository has 35 Pester tests: the rules, ID-based correlation, input validation, output escaping, redaction, end-to-end runs on the sample data and on a fixture of deliberately hostile device names, and a check that all 46 documented alert messages are mapped. They pass on PowerShell 7.6 and Windows PowerShell 5.1 with Pester 3.4.
A green test run only means something if the tests can go red. So I broke two behaviours on purpose, in a throwaway copy: I switched off the escaping of < in the HTML data block, and I let the generic "In progress" aggregate override a specific "Pending" status. The matching tests failed both times. Building the escaping, I also hit a real bug: the escape sequences in the source file had been silently decoded when it was saved, so the "escape" replaced a less-than sign with itself and the hostile device names went into the page raw. I caught it by inspecting the generated HTML, fixed it by building the escapes from character codes, and then added the tests that now guard it.
Speed
On a laptop with PowerShell 7, 2,000 devices take about 7 seconds from CSV to finished report, and 10,000 devices about 26 seconds, producing a 6.7 MB HTML file. Opening that 10,000-device report in a Chromium-based browser took about 1.4 seconds, and applying a filter about 0.1 seconds.
What this still cannot tell you
- It cannot see the device. It will never name the exact driver or application behind an
InstallSetupError. That needs SetupDiag and the setup logs on the machine. - It depends on the export's wording. State text is matched on the terms Microsoft documents. If your tenant words something differently, the state is reported as unrecognised. That is a deliberate fail-safe.
- Thresholds are judgement calls. A laptop on leave looks stale. Treat Suspected findings as leads.
- "Up to date" is relative to your data. It means the supplied data shows the update installed. If the export is a week old, so is that answer.
Where this goes next
Version 1 stops at files on purpose. Three things are not built yet, and I would rather say so than imply otherwise: automatic export through Graph (blocked on the permission question above, and note Microsoft documents throttling of 100 export requests per tenant per minute, with lower per-user and per-app limits), a read-only local probe for disk, TPM, Secure Boot and SetupDiag results, and scheduled trend reports. If you try the tool on real exports and a column name or a state word is not recognised, that is exactly the feedback that makes the next version better.
References
- Reports for Windows Feature Update Policies - the two reports, their columns, the update states, the data latency, and the table of 46 alert messages with recommendations.
- Intune Graph API - Reports and Properties - the
FeatureUpdateDeviceStatecolumns and its requiredPolicyIdfilter. - Use Graph APIs to Export Intune Reports - the export flow,
_loccolumns, the advice to select columns explicitly, and the throttling limits. - Create deviceManagementExportJob - the permissions table that lists only ReadWrite scopes.
- Microsoft Intune Reports - export and the reporting infrastructure in general.
Community deep-dives and related tools
| Author | Post or project | What it adds |
|---|---|---|
| Peter van der Woude | Easily exporting Intune reports using Microsoft Graph | The export request, status polling and download, walked through step by step (2020, so check current docs). |
| Jannik Reinhard | Intune mass export with the Graph Report API | A PowerShell export loop that lists FeatureUpdateDeviceState. The author notes its authentication code is retired, so use it for the request shape only. |
| UniFy Endpoint | Windows-Updates-Readiness | Intune remediation scripts that check, and can fix, update readiness on the device itself. It starts where this tool stops: on the endpoint. Its remediation script changes settings, so pilot it first. |
Related on EndpointWeekly
- A Safeguard Hold Is Blocking Your Feature Update - what a hold is and how to read the evidence on a device.
- SetupDiag: automatic upgrade failure analysis - the device-level companion to this fleet-level view.
- Windows 11 26H2 upgrade errors: drivers, storage and fixes - the common failure causes this tool surfaces.
- Windows 11 hardware requirements: TPM and CPU check - for the Windows 10 devices the tool flags.
Download it from Imran76Awan/Windows-Upgrade-Blocker-Analyzer — public, no sign-in required. It is read-only: it reads CSV files you supply and writes four output files. It calls no APIs and changes nothing on any device. Validate it in your own environment before relying on it.